Application Server: REST Graphing
From Resin 4.0 Wiki
(Difference between revisions)
(Created page with "{{Cookbook}} {{Integration}} =This page shows how to integrate Resin REST interface with a flot Graph library= Resin REST interface provides access to statistical data usin...") |
|||
| Line 83: | Line 83: | ||
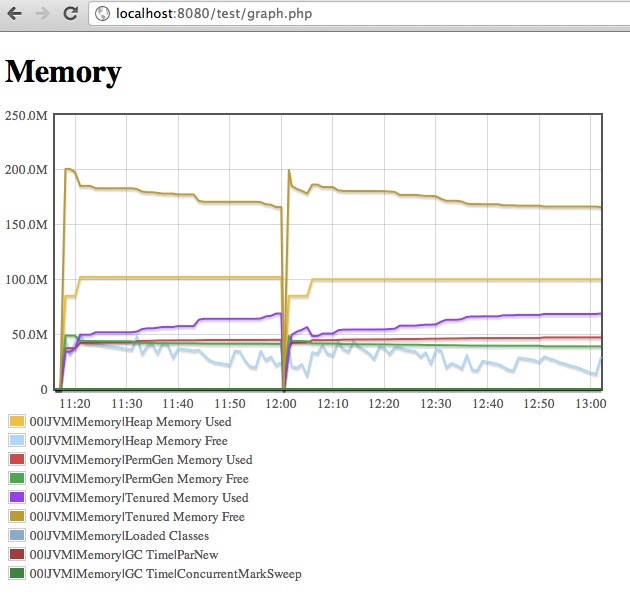
The result graph should look like a graph below: | The result graph should look like a graph below: | ||
| − | [[File: | + | [[File:RESTStatsJqueryFloatFraph.jpg]] |
Revision as of 00:00, 7 March 2012
This page shows how to integrate Resin REST interface with a flot Graph library
Resin REST interface provides access to statistical data using stats action. The stats action prints JSON formatted object array that can be fed right into jquery.flot engine.
Example: query Resin REST stats
curl --user admin:secret 'http://localhost:8080/resin-rest/stats?meters=JVM%7CMemory'
The template below queries the REST interface. The template application is available from :
Username (admin) and password need to be changed before the page can be used with your setup.
Template: memory.php
<!DOCTYPE HTML PUBLIC "-//W3C//DTD HTML 4.01 Transitional//EN"
   "http://www.w3.org/TR/html4/loose.dtd">
 <html>
 <head>
   <meta http-equiv="Content-Type" content="text/html; charset=utf-8">
   <title>Memory</title>
   <script language="javascript" type="text/javascript" src="jquery.js"></script>
   <script language="javascript" type="text/javascript"
           src="jquery.flot.js"></script>
 </head>
 <body>
 <div id="placeholder" style="width:600px;height:300px;"></div>
 <div id="legend" style="width:600px;height:300px;"></div>
  <script id="source">
   <?php
   $c = curl_init("http://localhost:8080/resin-rest/stats?meters=JVM%7CMemory");
   curl_setopt($c, CURLOPT_USERPWD, "admin:admin");
   curl_setopt($c, CURLOPT_RETURNTRANSFER, true);
   $json = curl_exec($c);
   echo "var data = $json;";
   ?>
   function tickFormatter(val, axis)
   {
     if (val >= 1e9)
       return (val / 1e9).toFixed(1) + 'G';
     if (val >= 1e6)
       return (val / 1e6).toFixed(1) + 'M';
     if (val >= 1e3)
       return (val / 1e3).toFixed(1) + 'k'

     return val.toFixed(axis.tickDecimals);
   }

   function draw(data)
   {
     var options = {
       xaxis:{ mode:"time", minTickSize:[1, "minute"]},
       yaxis:{tickFormatter:tickFormatter},
       legend:{container:"#legend"
       },
       series:{
         lines:{ show:true },
         points:{ show:false }
       }
     };

     $.plot($("#placeholder"), data, options);
   }

   var date = new Date();
   var offset = date.getTimezoneOffset() * 60 * 1000;
   date.getTimezoneOffset();
   var i = 0;
   for (i = 0; i < data.length; i++) {
     var j;
     for (j = 0; j < data[i].data.length; j++) {
       var t = data[i].data[j][0];
       data[i].data[j][0] = t - offset;
     }
   }

   draw(data);
 </script>

 </body>
 </html>
The result graph should look like a graph below:
